Advanced
Terminal UI
Inspect routes, exchanges, and live events from the terminal.
Prerequisites
The TUI reads from the SQLite database written by the telemetry() plugin. Enable it in your context before launching the UI:
import { CraftContext, telemetry } from '@routecraft/routecraft'

const ctx = new CraftContext({
  plugins: [telemetry()],
})
See Monitoring for full plugin options.
Launching the TUI
Start the TUI in a separate terminal while your context is running (or after it has stopped; the database persists):
craft tui
To read from a non-default database path:
craft tui --db ./logs/telemetry.db
The TUI polls the database every 2 seconds. Because SQLite runs in WAL mode, reads never block the running context.
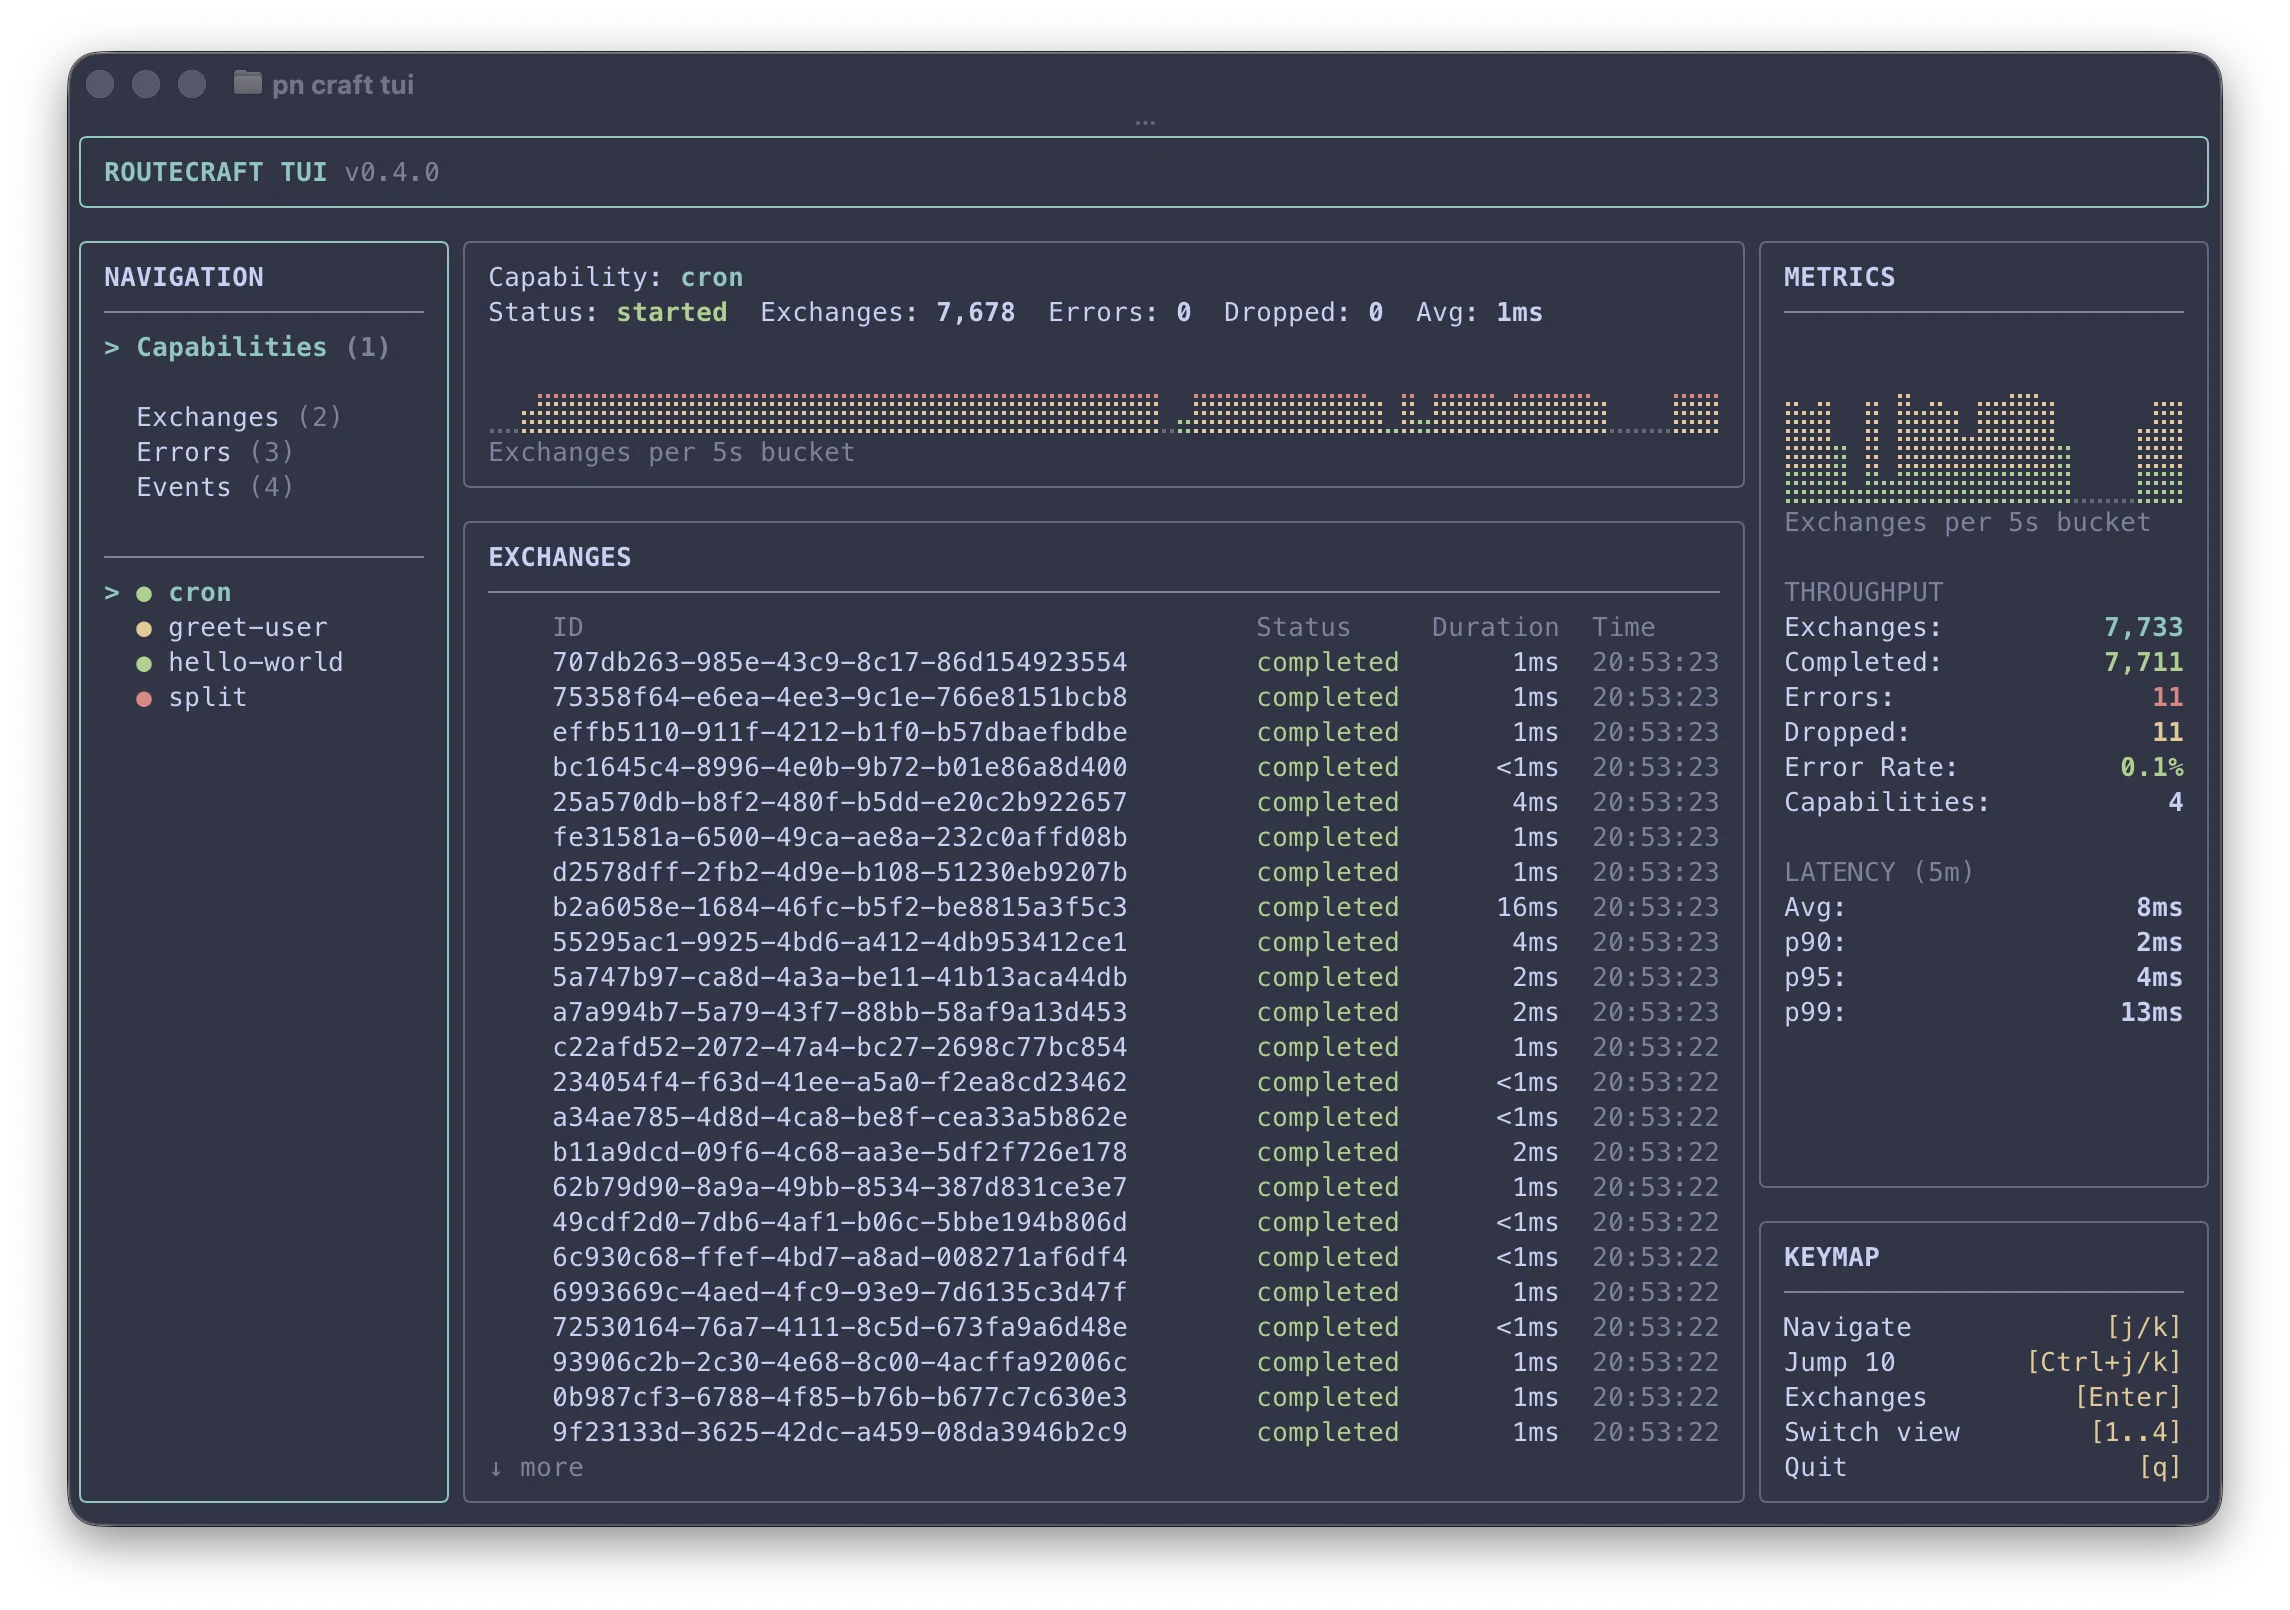
Layout
The TUI uses a three-column layout:
- Left -- Navigation panel (view switcher + capability list) and keymap
- Center -- Main content (exchange lists, exchange detail, or event stream)
- Right -- Metrics panel with throughput stats, latency percentiles (p90/p95/p99), and a live traffic sparkline
Views
Capabilities (1)
The default view. The left panel lists all routes (capabilities) seen in the database. Select a route to see its summary in the center panel with recent exchanges.
Press Enter to drill into a route's exchange list in the center panel. Press Esc to return focus to the route list.
Exchanges (2)
A chronological list of all exchanges across all routes, ordered most recent first.
| Column | Description |
|---|---|
| ID | Unique exchange identifier |
| Status | started, completed, failed, or dropped |
| Duration | Processing time |
| Time | Timestamp of the exchange |
Press Enter on any exchange to see its detail view with related events grouped by parent/child flow.
Errors (3)
Same layout as Exchanges but filtered to show only failed exchanges. Useful for quickly spotting and investigating failures.
Events (4)
A chronological tail of all framework events with human-readable summaries: context lifecycle, route lifecycle, exchange events, and step events. Useful for debugging unexpected behaviour.
| Column | Description |
|---|---|
| Timestamp | When the event occurred |
| Event | Full event name (e.g. route:myRoute:exchange:started) |
| Details | Formatted summary of the event payload |
Keyboard shortcuts
Navigation
| Key | Action |
|---|---|
j / ↓ | Move selection down |
k / ↑ | Move selection up |
Ctrl+j / Ctrl+↓ | Jump 10 rows down |
Ctrl+k / Ctrl+↑ | Jump 10 rows up |
Views and drill-down
| Key | Action |
|---|---|
1 | Switch to Capabilities view |
2 | Switch to Exchanges view |
3 | Switch to Errors view |
4 | Switch to Events view |
Enter | Drill into selected item (route exchanges or exchange detail) |
Esc | Go back to the previous panel or view |
q | Quit |
Related
Monitoring
Logging, events, and the telemetry plugin.
CLI reference
All craft commands and options.